In the 1.15.4. release
we made the measurement possibilities of FISHQuant complete. Not only
can FISHQuant work on cell samples, but the image processing of tissue
samples is also possible. The new program, while maintaining the
functionality of Cyto FISH, received a secondary non-specific
measurement option, which allows for the numerical analysis of
translocation probes, containing no structural abnormalities, and
display the combined results of the two measurements and statistical
analysis.
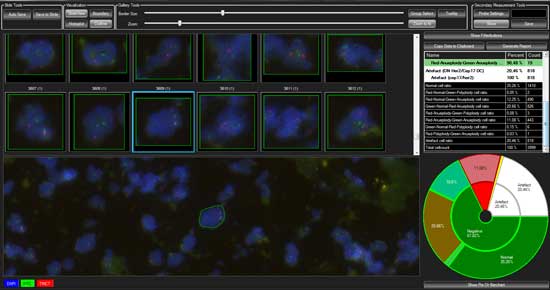
The new FISHQuant can be used for tissue and cytological
evaluation. Cytology samples which are cell cultures may contain cells
in metaphase whose identification and evaluation is done together with
the interphase cells as well as individually. Mitotic cells (metaphase)
in Cellcultures are also evaluated. The metaphase and interphase cells
results can be viewed together or separately.
• The algorithm can automatically identify the cells, and the signals,
• Probe specific Misp-file can be created for different samples containing the same marking,
• Users can select individual cells from a digital slide which can be evaluated in Quickmeasurement measurement mode
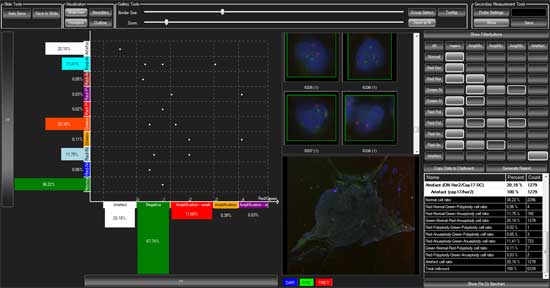
In many tumors, we encounter no specific deviations, but some numerical deviations . The program enables a secondary (numeric aberration) measurement method that identifies the numerical deviations of the candidate genes.
Histoplot: new visual display method for the amplification probes, in which the amplification rate group (gene / control mark =%) and the control gene marking numbers are displayed. It makes the reading of the aneoplid, polyploid populations amplification values easier.
Relationship between all populations, specific and non-specific (no difference) with one another to form easy to read display.